


Page 34 - FDMAsia MarApr 2025
P. 34
32   TECHNOLOGY                                                                   MAR/APR 2025 FDM ASIA | www.fdmasia.com


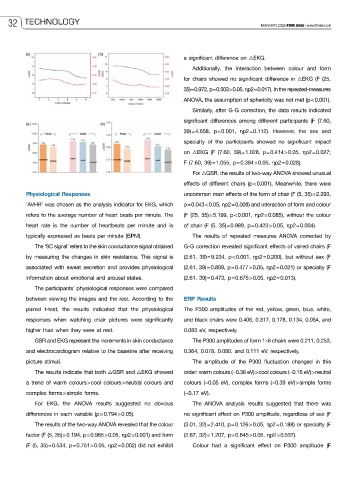
                                                             a significant difference on △EKG.
                                                                Additionally, the interaction between colour and form
                                                             for chairs showed no significant difference in  △EKG (F (25,
                                                             35) = 0.972, p = 0.503 > 0.05, ηp2 = 0.017). In the repeated-measures

                                                             ANOVA, the assumption of sphericity was not met (p < 0.001).
                                                                Similarly, after G-G correction, the data results indicated
                                                             significant differences  among different participants (F (7.60,
                                                             39) = 4.658,  p < 0.001,  ηp2 = 0.112). However, the sex and
                                                             specialty  of  the  participants  showed  no  significant  impact
                                                             on  △EKG  (F  (7.60,  39) = 1.028,  p = 0.414 > 0.05,  ηp2 = 0.027;
                                                             F (7.60, 39) = 1.055, p = 0.394 > 0.05, ηp2 = 0.028).
                                                                For △GSR, the results of two-way ANOVA showed unusual
                                                             effects of different chairs (p < 0.001). Meanwhile, there were

          Physiological Responses                            uncommon main effects of the form of chair (F (5, 35) = 2.293,
          ‘AVHR’ was chosen as the analysis indicator for EKG, which   p = 0.043 < 0.05, ηp2 = 0.008) and interaction of form and colour
          refers to the average number of heart beats per minute. The   (F (25, 35) = 5.199, p < 0.001, ηp2 = 0.085), without the colour
          heart rate is the number of heartbeats per minute and is   of chair (F (5, 35) = 0.989, p = 0.423 > 0.05, ηp2 = 0.004).
          typically expressed as beats per minute (BPM).        The results of repeated measures ANOVA corrected by
            The ‘SC signal’ refers to the skin conductance signal obtained   G-G correction revealed significant effects of varied chairs (F
          by measuring the changes in skin resistance. This signal is   (2.61,  39) = 9.234,  p < 0.001,  ηp2 = 0.200), but without sex (F

          associated  with  sweat  secretion  and  provides  physiological   (2.61, 39) = 0.809, p = 0.477 > 0.05, ηp2 = 0.021) or specialty (F
          information about emotional and arousal states.    (2.61, 39) = 0.473, p = 0.675 > 0.05, ηp2 = 0.013).
            The participants’ physiological responses were compared
          between viewing the images and the rest. According to the   ERP Results
          paired t-test, the results indicated that the physiological   The P300 amplitudes of the red, yellow, green, blue, white,
          responses when watching chair pictures were significantly   and black chairs were 0.406, 0.317, 0.178, 0.134, 0.054, and
          higher than when they were at rest.                0.083 eV, respectively.
            GSR and EKG represent the increments in skin conductance   The P300 amplitudes of form 1–6 chairs were 0.211, 0.253,
          and electrocardiogram relative to the baseline after receiving   0.364, 0.078, 0.080, and 0.111 eV, respectively.

          picture stimuli.                                      The amplitude of the P300 fluctuation changed in this
            The results indicate that both △GSR and △EKG showed   order: warm colours (−0.36 eV) > cool colours (−0.16 eV) > neutral
          a trend of warm colours > cool colours > neutral colours and   colours (−0.05 eV), complex forms (−0.39 eV) > simple forms
          complex forms > simple forms.                      (−0.17 eV).
            For EKG, the ANOVA results suggested no obvious     The ANOVA analysis results suggested that there was
          differences in each variable (p = 0.794 > 0.05).   no significant effect on P300 amplitude, regardless of sex (F
            The results of the two-way ANOVA revealed that the colour   (3.01, 32) = 2.410, p = 0.126 > 0.05, ηp2 = 0.188) or specialty (F

          factor (F (5, 35) = 0.194, p = 0.965 > 0.05, ηp2 = 0.001) and form   (2.67, 32) = 1.207, p = 0.645 > 0.05, ηp2 = 0.537).
          (F (5, 35) = 0.534, p = 0.751 > 0.05, ηp2 = 0.002) did not exhibit   Colour had a significant effect on P300 amplitude (F

