


Page 33 - FDMAsia MarApr 2025
P. 33
TECHNOLOGY           31
         www.fdmasia.com | FDM ASIA MAR/APR 2025


          Behavioural Results                                effect of the form of chairs (F (5, 35) = 0.809, p = 0.543 > 0.05,
          Descriptive statistical analyses were conducted on the scores   ηp2 = 0.003), or interaction between colour and form (F (5,
          for each colour and form using SPSS software.      5) = 0.290, p = 0.998 > 0.05, ηp2 = 0.005).
            The  results  show that  there  was little  difference in the   Moreover, Mauchly’s test indicated that the assumption

          average scores.                                    of sphericity was violated (p < 0.05). Thus, the statistics were
            Next, we combined the results of the measured data plotted.   reported based on the Greenhouse-Geisser correction. The results
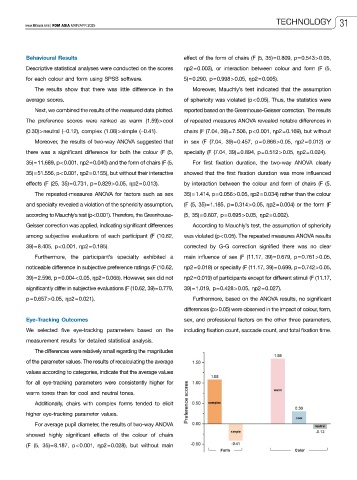
          The preference scores were ranked as warm (1.59) > cool   of repeated measures ANOVA revealed notable differences in
          (0.30) > neutral (−0.12), complex (1.08) > simple (−0.41).   chairs (F (7.04, 39) = 7.506, p < 0.001, ηp2 = 0.169), but without
            Moreover, the results of two-way ANOVA suggested that   in  sex  (F  (7.04,  39) = 0.457,  p = 0.866 > 0.05,  ηp2 = 0.012)  or
          there was a significant difference for both the colour (F (5,   specialty (F (7.04, 39) = 0.894, p = 0.512 > 0.05, ηp2 = 0.024).
          35) = 11.689, p < 0.001, ηp2 = 0.040) and the form of chairs (F (5,   For first fixation duration, the two-way ANOVA clearly
          35) = 51.556, p < 0.001, ηp2 = 0.155), but without their interactive   showed that the first fixation duration was more influenced
          effects (F (25, 35) = 0.731, p = 0.829 > 0.05, ηp2 = 0.013).  by interaction between the colour and form of chairs (F (5,

            The repeated-measures ANOVA for factors such as sex   35) = 1.414, p = 0.056 > 0.05, ηp2 = 0.034) rather than the colour
          and specialty revealed a violation of the sphericity assumption,   (F (5, 35) = 1.185, p = 0.314 > 0.05, ηp2 = 0.004) or the form (F
          according to Mauchly’s test (p < 0.001). Therefore, the Greenhouse-  (5, 35) = 0.607, p = 0.695 > 0.05, ηp2 = 0.002).
          Geisser correction was applied, indicating significant differences   According to Mauchly’s test, the assumption of sphericity
          among subjective evaluations of each participant (F (10.62,   was violated (p < 0.05). The repeated measures ANOVA results
          39) = 8.405, p < 0.001, ηp2 = 0.185).              corrected by G-G correction signified there was no clear
            Furthermore, the participant’s specialty exhibited a   main influence of sex (F (11.17, 39) = 0.679, p = 0.761 > 0.05,

          noticeable difference in subjective preference ratings (F (10.62,   ηp2 = 0.018) or specialty (F (11.17, 39) = 0.699, p = 0.742 > 0.05,
          39) = 2.596, p = 0.004 < 0.05, ηp2 = 0.066). However, sex did not   ηp2 = 0.019) of participants except for different stimuli (F (11.17,
          significantly differ in subjective evaluations (F (10.62, 39) = 0.779,   39) = 1.019, p = 0.428 > 0.05, ηp2 = 0.027).
          p = 0.657 > 0.05, ηp2 = 0.021).                       Furthermore, based on the ANOVA results, no significant
                                                             differences (p > 0.05) were observed in the impact of colour, form,
          Eye-Tracking Outcomes                              sex, and professional factors on the other three parameters,
          We selected five eye-tracking parameters based on the   including fixation count, saccade count, and total fixation time.
          measurement results for detailed statistical analysis.
            The differences were relatively small regarding the magnitudes

          of the parameter values. The results of recalculating the average
          values according to categories, indicate that the average values
          for  all  eye-tracking  parameters  were  consistently  higher  for
          warm tones than for cool and neutral tones.
            Additionally, chairs with complex forms tended to elicit
          higher eye-tracking parameter values.
            For average pupil diameter, the results of two-way ANOVA

          showed highly significant effects of the colour of chairs
          (F  (5,  35) = 8.187,  p < 0.001,  ηp2 = 0.028), but without main

