


Page 45 - FDMAsia SepOct 2025
P. 45
TECHNOLOGY           43
         www.fdmasia.com | FDM ASIA SEP/OCT 2025


          permit the analysis of only one single factor. In this approach,   the sawmill capacities in the example. However, these linear
          the  data  are  first rank  transformed,  then  a  factorial ANOVA   relationships may not hold, as, for example, a small sawmill
          is performed.                                      most likely will pay higher prices for their logs compared to
            Post-hoc pairwise comparisons were conducted using   a large mill and large mills might realise technical economies

          ART-C. ART-C showed the instances where the profit   of scale.
          differences attributable to any combination of factor changes
          were significant (α = 0.05).                       Operating Cost
                                                             The Aligned Rank Transform (ART) statistical test in conjunction
          Results                                            with R (R Core Team 2022) showed that a 0.1 percent change in
          The 1,000-log sample was processed with LORCAT using the   hourly operating cost caused a statistically significant difference
          specifications and settings defined in the methods (Table 5).   in profit (α = 0.05) for a sawmill with 12 MMBF capacity.
          For a 12 MMBF sawmill, LORCAT estimated that it would   The analysis was repeated for 8 and 4 MMBF sawmill
          take 3.17 hours to process the 1,000-log sample (Table 4).  capacities, and the same differences that were significant

                                                             with the 12 MMBF sawmills were found to be significant (α
          Table 5. Base Costs and Values for the 12 MMBF Annual
          Capacity Analysis                                  = 0.05) with the smaller capacity mills.
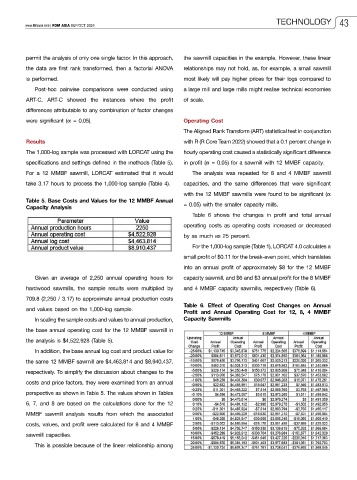
                                                                Table 6 shows the changes in profit and total annual
                                                             operating costs as operating costs increased or decreased
                                                             by as much as 25 percent.
                                                                For the 1,000-log sample (Table 1), LORCAT 4.0 calculates a
                                                             small profit of $0.11 for the break-even point, which translates

                                                             into an annual profit of approximately $8 for the 12 MMBF
            Given an average of 2,250 annual operating hours for   capacity sawmill, and $6 and $3 annual profit for the 8 MMBF
          hardwood sawmills, the sample results were multiplied by   and 4 MMBF capacity sawmills, respectively (Table 6).
          709.8 (2,250 / 3.17) to approximate annual production costs
                                                             Table 6. Effect of Operating Cost Changes on Annual
          and values based on the 1,000-log sample.
                                                             Profit and Annual Operating Cost for 12, 8, 4 MMBF
            In scaling the sample costs and values to annual production,   Capacity Sawmills
          the base annual operating cost for the 12 MMBF sawmill in
          the analysis is $4,522,928 (Table 5).
            In addition, the base annual log cost and product value for

          the same 12 MMBF sawmill are $4,463,814 and $8,940,437,
          respectively. To simplify the discussion about changes to the
          costs and price factors, they were examined from an annual
          perspective as shown in Table 5. The values shown in Tables
          6, 7, and 8 are based on the calculations done for the 12
          MMBF sawmill analysis results from which the associated
          costs, values, and profit were calculated for 8 and 4 MMBF

          sawmill capacities.
            This is possible because of the linear relationship among

