


Page 42 - FDMAsia SepOct 2025
P. 42
40   TECHNOLOGY                                                                   SEP/OCT 2025 FDM ASIA | www.fdmasia.com


            Operating costs refer to the maintenance and administration   the pwr package  was used to determine that a sample size
          of a business on a day-to-day basis. Horngren et al.  define   of 1,000 logs resulted in a statistical power of 0.832 with a
          operating costs as  “all costs  associated  with  generating   significance level of 0.05.
          revenues, other than cost of goods sold.” However, this study   A statistical power of 0.832 means that 83.2 percent of

          takes a broader view of operating cost in that operating cost   the time, a statistically significant result will be observed when
          denotes all expenses incurred to make and sell the product.  present, while 16.8 percent of the time, the analysis would fail
                                                             to find a significant difference where one existed.
          Cost Information                                      Power values for statistical analyses typically range between
          Using the LOg ReCovery Analysis Tool, this study investigated   0.8 and 0.9. Based on the power analysis results, a 1,000 log
          the  cost  structure  of  an  eastern  U.S.  hardwood  sawmill   sample consisting of 500 Factory 1 grade and 500 Factory
          producing red oak lumber.                          2 grade red oak (Quercus rubra) logs was created using the
            Lacking access to mills’ accounting information, this study   LORCAT log sample creation tool.
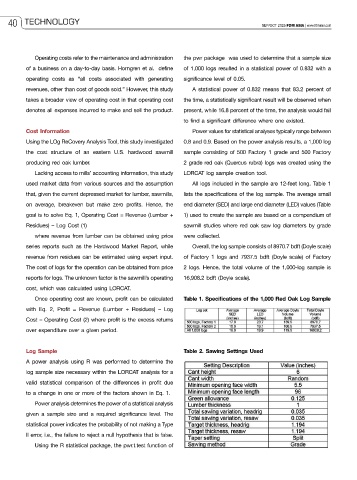
          used market data from various sources and the assumption   All logs included in the sample are 12-feet long. Table 1

          that, given the current depressed market for lumber, sawmills,   lists the specifications of the log sample. The average small
          on  average,  breakeven  but  make  zero  profits. Hence, the   end diameter (SED) and large end diameter (LED) values (Table
          goal is to solve Eq. 1, Operating Cost = Revenue (Lumber +   1) used to create the sample are based on a compendium of
          Residues) – Log Cost (1)                           sawmill studies where red oak saw log diameters by grade
            where revenue from lumber can be obtained using price   were collected.
          series reports such as the Hardwood Market Report, while   Overall, the log sample consists of 8970.7 bdft (Doyle scale)
          revenue from residues can be estimated using expert input.  of Factory 1 logs and 7937.5 bdft (Doyle scale) of Factory

          The cost of logs for the operation can be obtained from price   2 logs. Hence, the total volume of the 1,000-log sample is
          reports for logs. The unknown factor is the sawmill’s operating   16,908.2 bdft (Doyle scale).
          cost, which was calculated using LORCAT.
            Once operating cost are known, profit can be calculated   Table 1. Specifications of the 1,000 Red Oak Log Sample
          with Eq. 2, Profit = Revenue (Lumber + Residues) – Log
          Cost – Operating Cost (2) where profit is the excess returns
          over expenditure over a given period.


          Log Sample                                         Table 2. Sawing Settings Used

          A power analysis using R was performed to determine the
          log sample size necessary within the LORCAT analysis for a
          valid statistical comparison of the differences in profit due
          to a change in one or more of the factors shown in Eq. 1.
            Power analysis determines the power of a statistical analysis
          given a sample size and a required significance level. The
          statistical power indicates the probability of not making a Type

          II error, i.e., the failure to reject a null hypothesis that is false.
            Using the R statistical package, the pwr.t.test function of

