


Page 43 - FDMAsia JanFeb 2025
P. 43
TECHNOLOGY           41
         www.fdmasia.com | FDM ASIA JAN/FEB 2025


            The samples were prepared for impregnation by placing   an increasing number of laser shots, which were delivered in
          them vertically in the solution, one above the other.   the same place, and then recording the number of spectra
            They were loaded with glass beads to prevent the wood   created by subsequent laser shots.
          samples from floating to the surface. Wood impregnation was   The focal length of the focusing lens was 150 mm. The

          performed using a single vacuum and an ultrasound. Vacuum   distance  of  the  lens  from  the  wood  was  set  to  140  mm  to
          impregnation was performed in a vacuum dryer model 1445-  avoid an accidental laser breakdown in air.
          2 (with a pump model V-700. The impregnation was carried   The geometry of the sample irradiation was as follows: the
          out under the following conditions: vacuum 190 mbar, time   laser beam was perpendicular to the wood sample surface,
          30 min, temperature 28 deg C.                      i.e., the angle of incidence calculated from the normal to the
            Then, the pressure in the chamber was brought to   surface was 0 degree, while the spectra were collected at
          atmospheric pressure, and the samples were left in the solution   the angle of approximately 60 degrees  to the surface,  i.e.,
          for another 30 minutes. The samples were removed from the   30 degrees from the normal to the surface.
          graphene oxide dispersion and left to dry.            The diameter of the laser spot focal point on the wood

            Pressureless impregnation was performed using an ultrasonic   surface with the assumed dimensions of the distance between
          bath. The impregnation process was carried out under the   the lens and the wood was approximately 0.1–0.3 mm,
          following conditions: time 30 min, temperature 22 deg C. After   depending on wood age (late or early one). The laser fluence
          completing the process, the samples were left in the solution   was 0.14 J/mm2. The ablation rate was between 0.08 ÷ 0.12
          for another 30 minutes. The samples were removed from the   mm3/pulse and 0.71 ÷ 1.06 mm3/pulse for ablation craters
          graphene oxide dispersion and left to dry.         of 10–15 µm in depth.
            The wood samples were coded as follows:             Since there are visible divisions between early and late

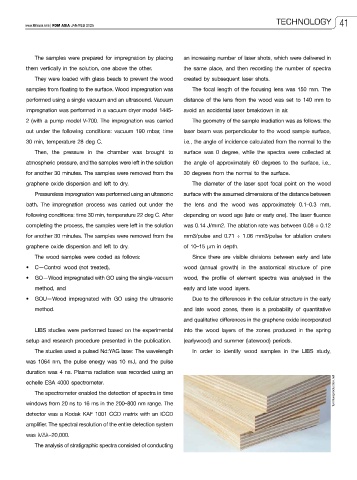
          •  C—Control wood (not treated),                   wood (annual growth) in the anatomical structure of pine
          •  GO—Wood impregnated with GO using the single-vacuum   wood, the profile of element spectra was analysed in the
            method, and                                      early and late wood layers.
          •  GOU—Wood impregnated with GO using the ultrasonic   Due to the differences in the cellular structure in the early
            method.                                          and  late  wood  zones,  there  is  a  probability  of  quantitative
                                                             and qualitative differences in the graphene oxide incorporated
            LIBS studies were performed based on the experimental   into the wood layers of the zones produced in the spring
          setup and research procedure presented in the publication.   (earlywood) and summer (latewood) periods.
            The studies used a pulsed Nd:YAG laser. The wavelength   In order to identify wood samples in the LIBS study,

          was 1064 nm, the pulse energy was 10 mJ, and the pulse
          duration was 4 ns. Plasma radiation was recorded using an
          echelle ESA 4000 spectrometer.
            The spectrometer enabled the detection of spectra in time                                         furnitureproduction.net
          windows from 20 ns to 16 ms in the 200–800 nm range. The
          detector was a Kodak KAF 1001 CCD matrix with an ICCD
          amplifier. The spectral resolution of the entire detection system

          was λ/Δλ~20,000.
            The analysis of stratigraphic spectra consisted of conducting

