


Page 47 - FDMAsia Nov/Dec 2025
P. 47
MATERIALS         45
         www.fdmasia.com | FDM ASIA NOV/DEC 2025


          ahead of a crack tip and have been successfully used with                                           Piotrekswat
          a modified Paris' law to simulate fatigue damage.
            Commercial software packages like ABAQUS and ANSYS
          are typically used for these complex simulations, with dedicated

          modules for composite materials becoming increasingly
          available for wood-based products. These tools allow for the
          optimisation of designs to be both lighter and safer against
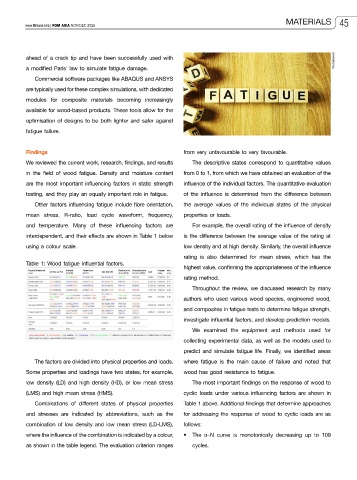
          fatigue failure.


          Findings                                           from very unfavourable to very favourable.
          We reviewed the current work, research, findings, and results   The descriptive states correspond to quantitative values
          in the field of wood fatigue. Density and moisture content   from 0 to 1, from which we have obtained an evaluation of the
          are the most important influencing factors in static strength   influence of the individual factors. The quantitative evaluation

          testing, and they play an equally important role in fatigue.   of the influence is determined from the difference between
            Other factors influencing fatigue include fibre orientation,   the  average  values  of  the  individual  states  of  the  physical
          mean stress, R-ratio, load cycle waveform, frequency,   properties or loads.
          and temperature. Many of these influencing factors are   For example, the overall rating of the influence of density
          interdependent, and their effects are shown in Table 1 below   is the difference between the average value of the rating at
          using a colour scale.                              low density and at high density. Similarly, the overall influence
                                                             rating  is also  determined  for  mean  stress, which  has the
          Table 1: Wood fatigue influential factors.
                                                             highest value, confirming the appropriateness of the influence
                                                             rating method.
                                                                Throughout the review, we discussed research by many
                                                             authors who used various wood species, engineered wood,
                                                             and composites in fatigue tests to determine fatigue strength,
                                                             investigate influential factors, and develop prediction models.
                                                                We  examined  the  equipment  and  methods  used  for
                                                             collecting experimental data, as well as the models used to
                                                             predict and simulate fatigue life. Finally, we identified areas

            The factors are divided into physical properties and loads.   where  fatigue is the  main  cause  of failure  and noted that
          Some properties and loadings have two states, for example,   wood has good resistance to fatigue.
          low density (LD) and high density (HD), or low mean stress   The most important findings on the response of wood to
          (LMS) and high mean stress (HMS).                  cyclic loads under various influencing factors are shown in
            Combinations  of  different  states  of  physical  properties   Table 1 above. Additional findings that determine approaches
          and stresses are indicated by abbreviations, such as the   for addressing the response of wood to cyclic loads are as
          combination of low density and low mean stress (LD-LMS),   follows:

          where the influence of the combination is indicated by a colour,   •  The  α−N curve is monotonically decreasing up to 109
          as shown in the table legend. The evaluation criterion ranges   cycles.

